Dashboards - How to use Jira
<< || Components <
Contents
Dashboards are a place where you can view a lot of information.
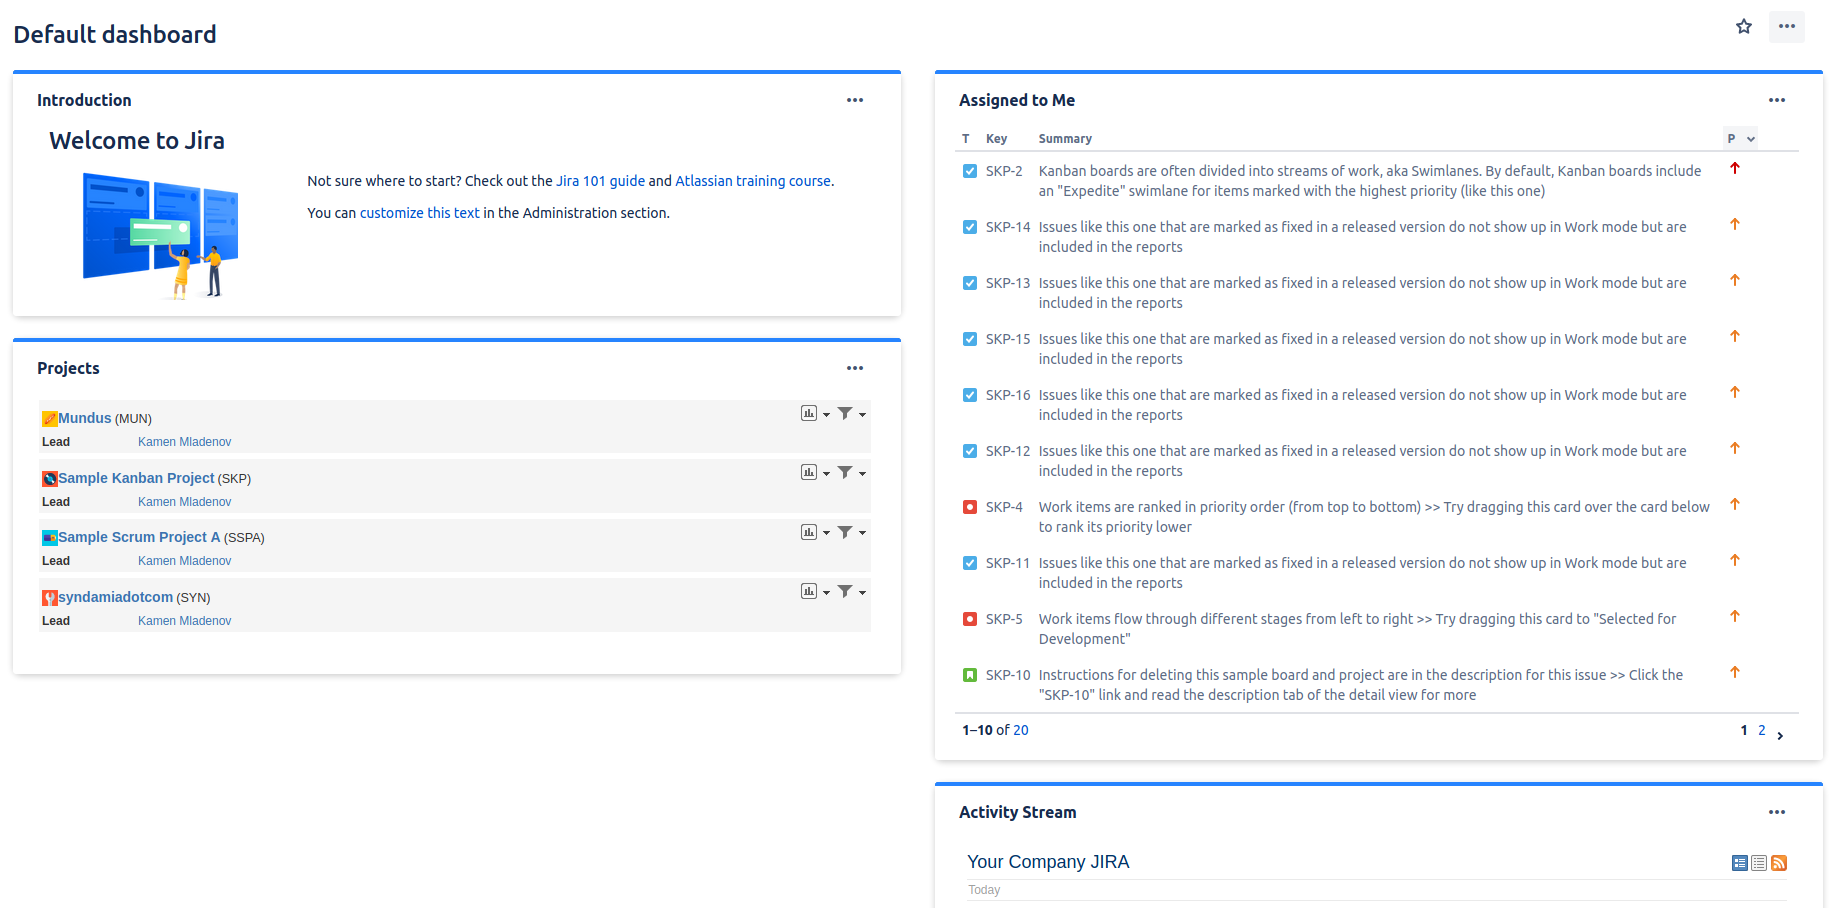
Dashboards are composed of gadgets.
Gadgets have functionality for displaying certain information, like Average Age Chart or Issues in progress. Each gadget can be setup to take information from one or more projects and/or saved filters.
Adding a dashboard
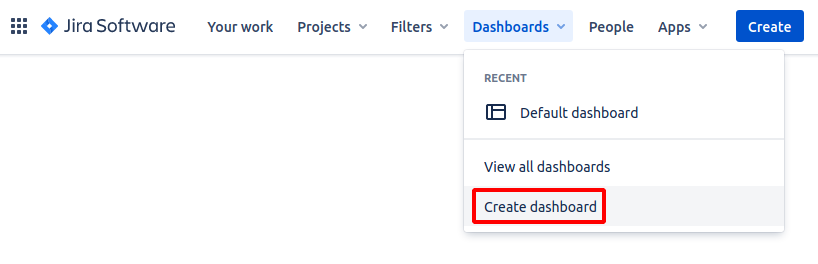
Dashboard can be added from the top bar, under Create dashboard in the Dashboards menu
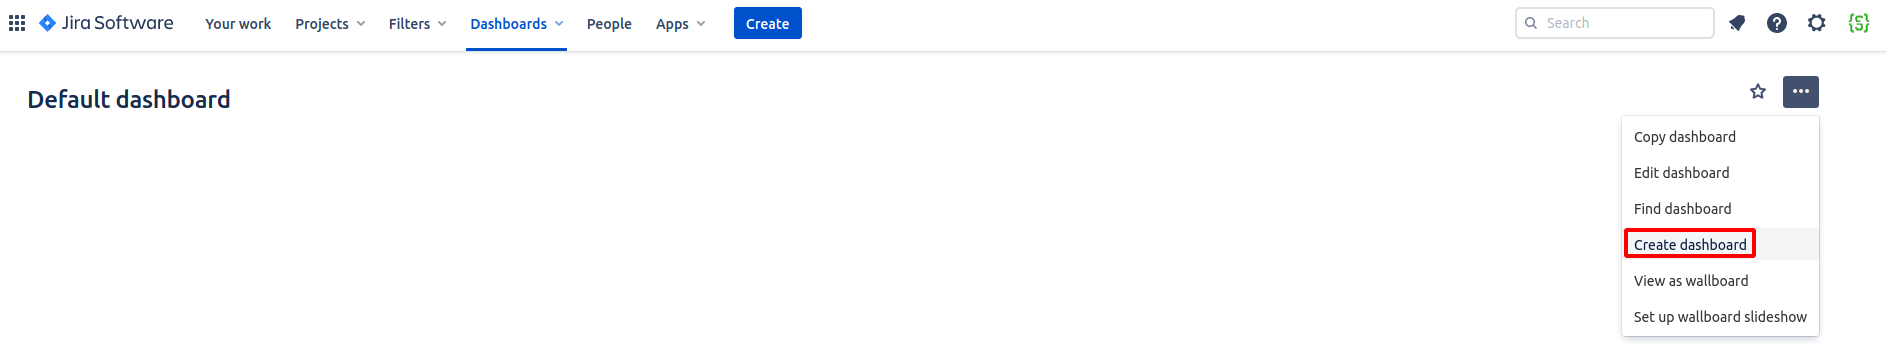
or, if you are already in a dashboard, from Create dashboard in the three dots menu.
Adding gadgets
Note: you cannot add gadgets to the default dashboard.
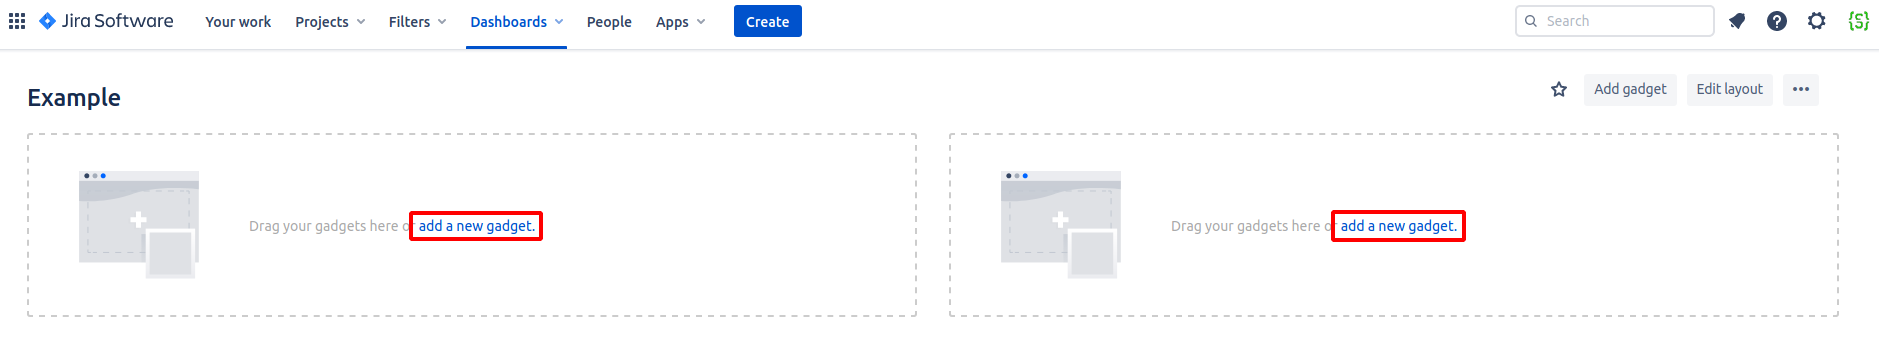
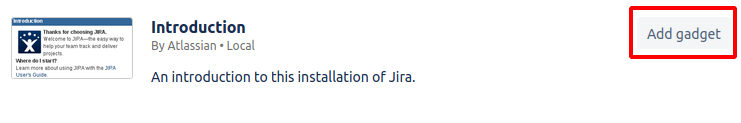
You can add gadgets either through the Add gadget button in the top right

or, if you don't have any gadets, from the add a new gadget message(s).
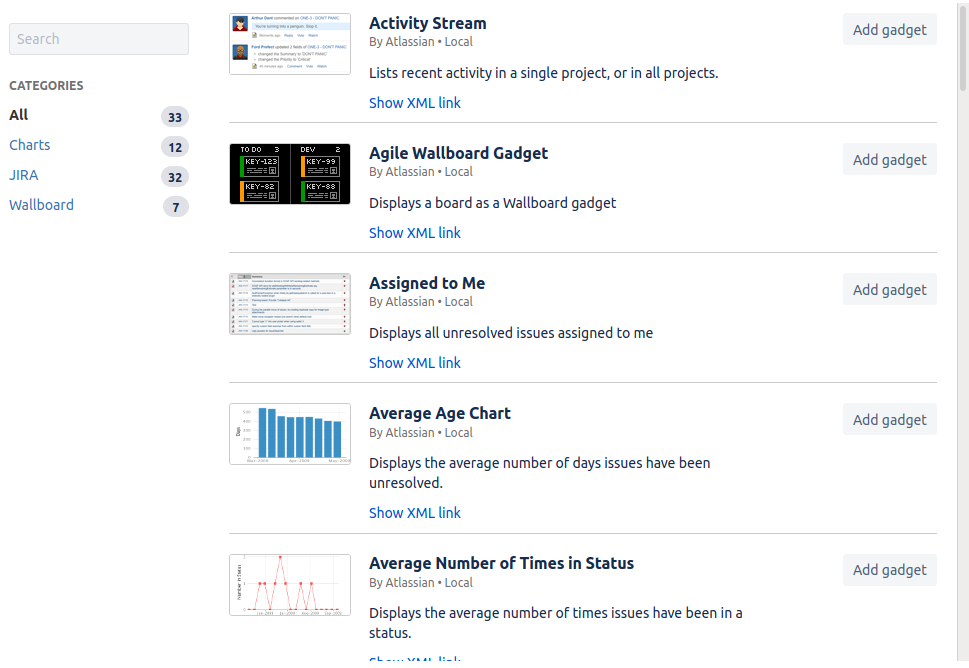
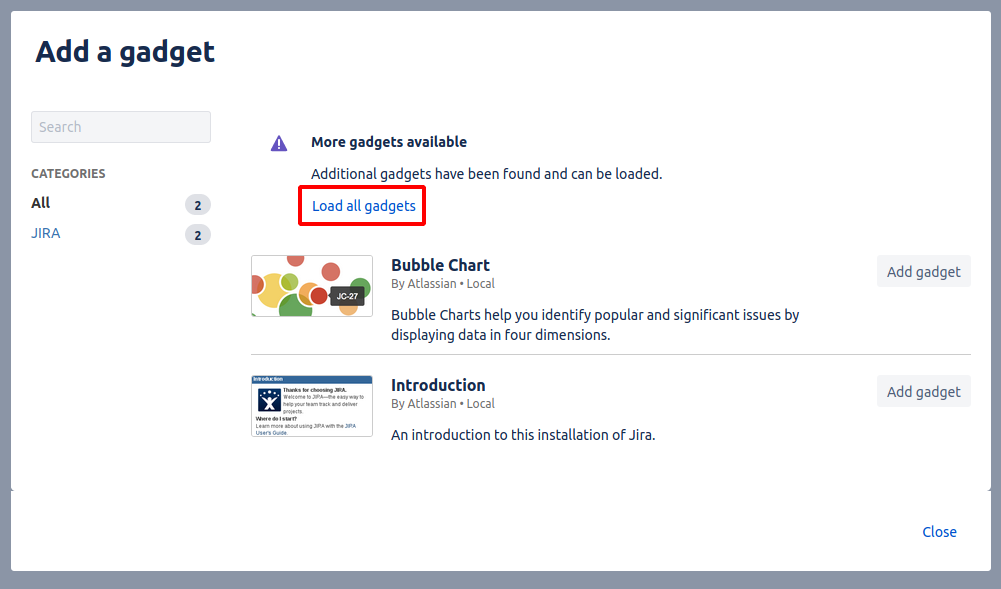
After that, you are greeted by a window that shows all of the avalable ones (you might need to press Load all gadgets).
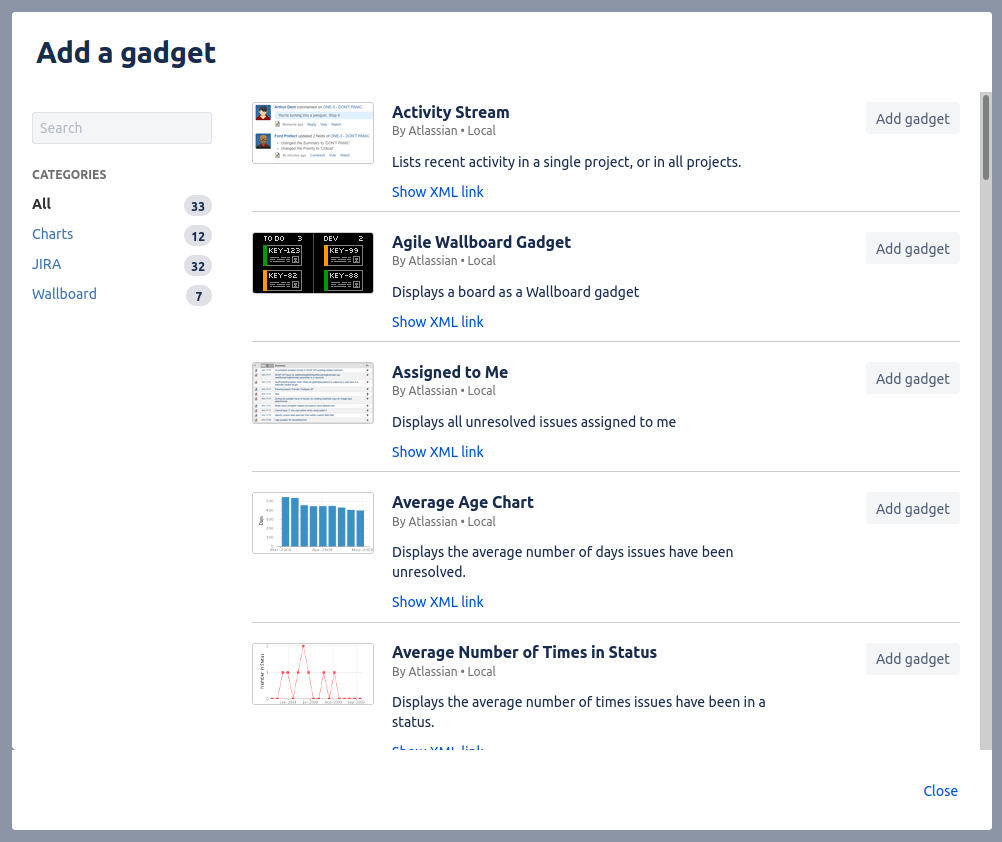
Adding a gadget is as simple as clicking the button Add gadget next to the name of the gadget you want to add.
After it is added, you'll need to configure it, usually a gadget requires atleast a filter/project.
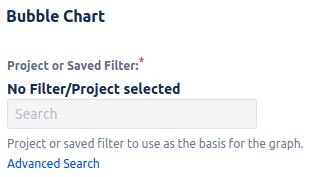
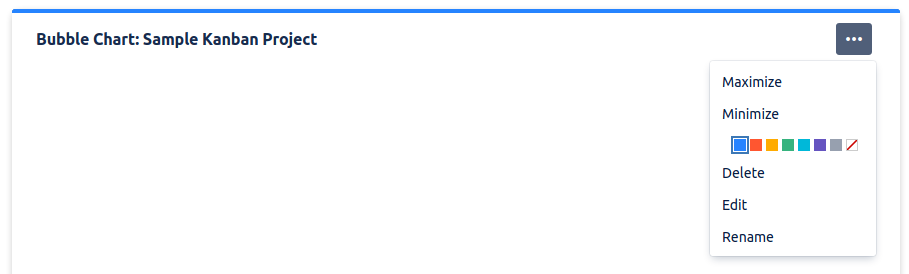
Options for different gadgets can be found on their top right corner, in the three dots menu.